 By William Janhonen
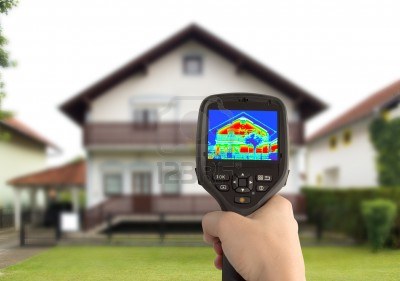
As human beings, we see visible light only in a very limited band of the light spectrum. Infrared thermography and thermal imaging are part of a science that can detect radiation in the infrared range of the electromagnetic spectrum. Thermography made national news recently when it was used by police and security personnel to capture one of the suspected Boston Marathon bombers.
Thermography has a long history, but its use has dramatically increased over the past 50 years with applications in the commercial and industrial markets. Firefighters use thermography to see through smoke to find people trapped in buildings, and to find the base of a fire. Building construction uses thermography to find heat leaks in faulty thermal insulation and uses data to improve efficiency of heating and cooling units. Some physiological changes in human beings and other warm-blooded animals can be detected with thermal imaging during clinical tests.
The Second Law of Thermodynamics
states that heat will move from warm to cold, and if an object is radiating at a higher temperature than its surroundings, then the power transfer can be viewed by capturing a thermal image. This thermal image capture has become a very useful tool in building diagnostics because it helps detect faults hidden in walls, improper HVAC installation, insulation errors, moisture damage and loss of energy through infiltration/exfiltration without damaging the structure. HERS (Home Energy Rating System) raters and building consultants can use thermography to pinpoint leakage in ducts, air sealing deficiencies, leaking around windows, doors, can lights and gaps in flooring. Moisture damage is a large, invisible danger that shows up clearly in a thermal image since water evaporates slowly, showing a cooler area than surrounding dry areas.
As a certified thermographer, I have seen some amazing images, taken in a variety of homes and buildings, which outline some dramatic energy losses. Without the use of a thermal imaging camera, finding and analyzing the source of the leaks would have taken greater time and effort. Some of the examples of how thermography can detect building faults are shown here:
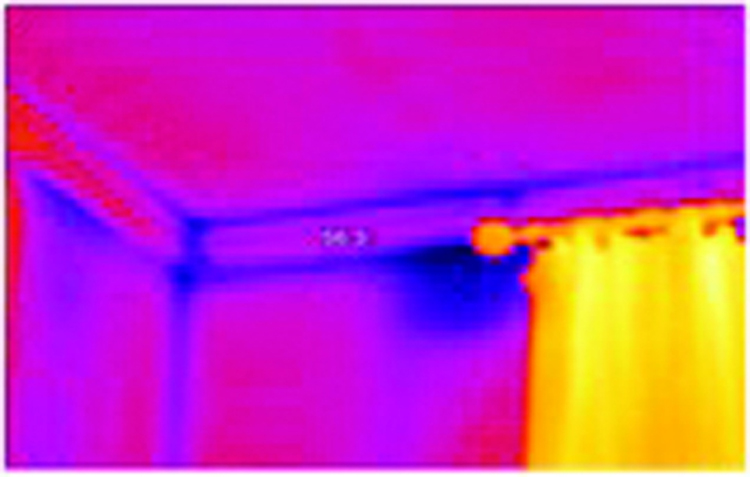
A leak at the ceiling can mean the band joist is faulty.
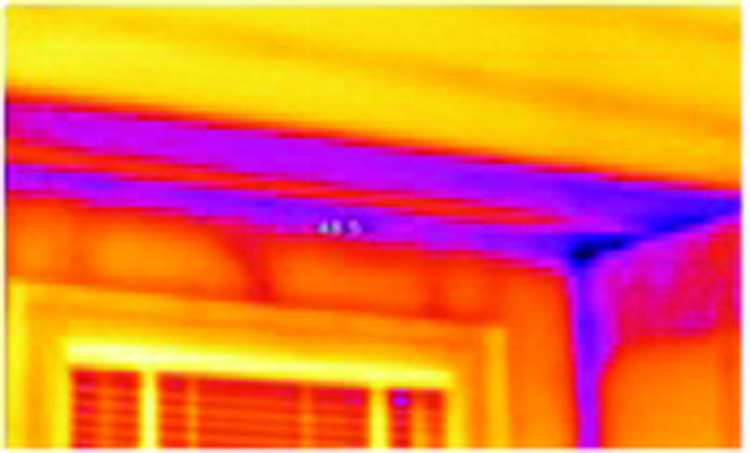
The dark bands show where insulation seems to have been forgotten. The dark lines in the corner indicate large leakage between walls and ceiling.
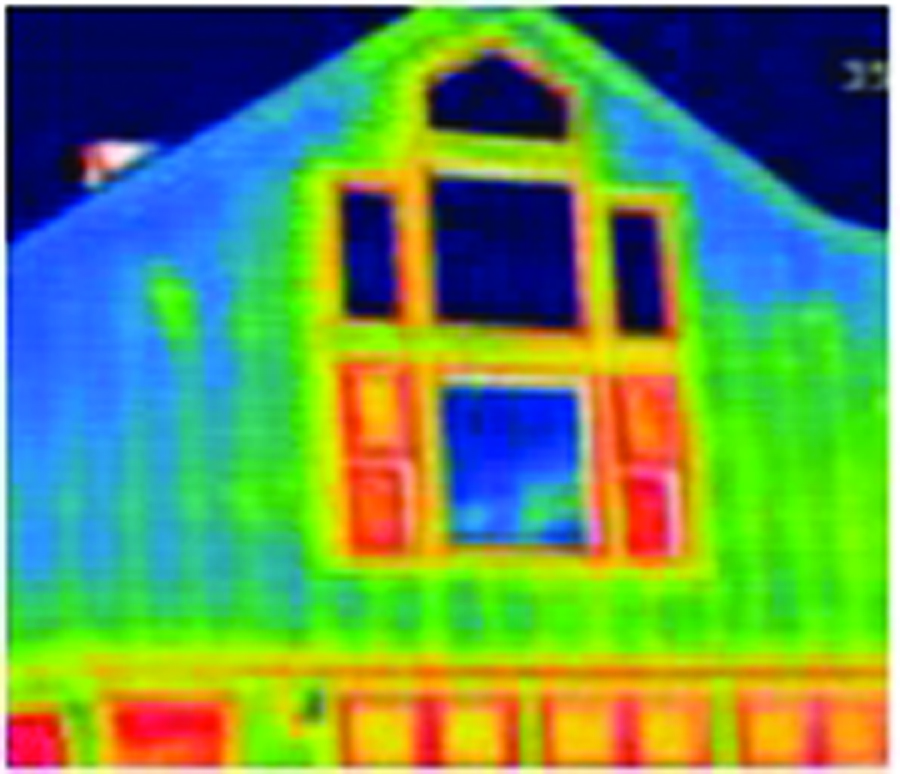
This house shows a combination of images. Thermal bridging is indicated by the bands of green against the cool blue background. Heat is strongly indicated at the bright red and yellow areas despite a very cool roof.
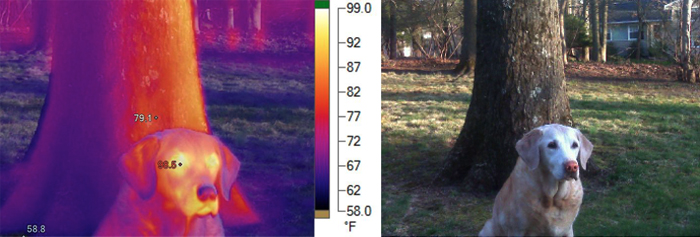
This is an amazing contrast of visible imaging depicted next to the thermal image. Notice the dark blue on the north side of the tree, where moss grows and the radiant temperature difference is dramatic. The Labrador’s eyes are bright because of the “nightshine” property of some animals. The temperature reading at the eyes happens to be 98 degrees, indicating a healthy dog.


